We are a forward-looking company with a proven strategy that is delivering value for our shareholders. Read more about our performance in detail.
Performance highlights
Our strategy continued to deliver in 2014. In a tough trading environment we achieved strong results while continuing to invest in our future.
Our five Global Drive Brands (GDBs) had another successful year in 2014, growing volume and market share.
Take a look at how our four regions performed in 2014.
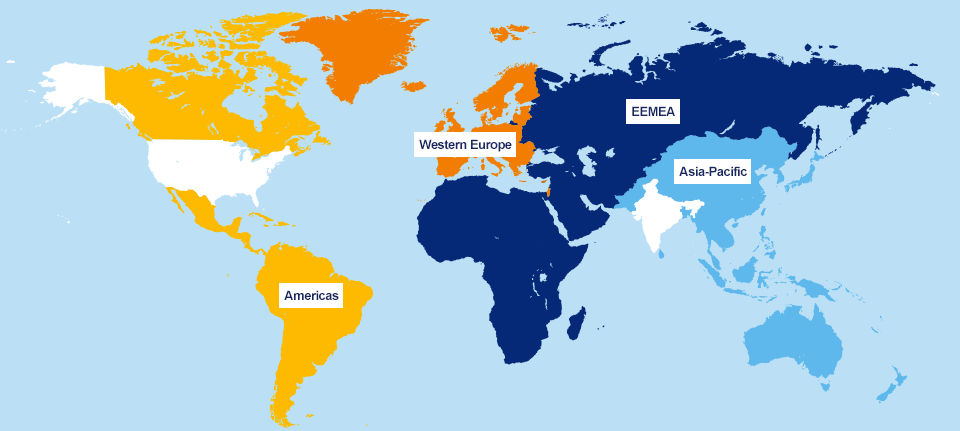
Americas
Close
Volume
2013: 134bn
131bn
-2.3%2013: 134bn
Revenue at CC1
2013: £3,317m
£3,506m
+5.7%2013: £3,317m
Adjusted profit from operations2
2013: £1,364m
£1,286m
-5.7%2013: £1,364m
Adjusted profit from operations2 at CC1
2013: £1,364m
£1,475m
+8.1%2013: £1,364m
Western Europe
Close
Volume
2013: 119bn
112bn
-5.9%2013: 119bn
Revenue at CC1
2013: £3,635m
£3,546m
-2.4%2013: £3,635m
Adjusted profit from operations2
2013: £1,273m
£1,189m
-6.6%2013: £1,273m
Adjusted profit from operations2 at CC1
2013: £1,273m
£1,262m
-0.9%2013: £1,273m
EEMEA
Close
Volume
2013: 226bn
227bn
+0.3%2013: 226bn
Revenue at CC1
2013: £4,105m
£4,377m
+6.6%2013: £4,105m
Adjusted profit from operations2
2013: £1,490m
£1,380m
-7.4%2013: £1,490m
Adjusted profit from operations2 at CC1
2013: £1,490m
£1,625m
+9.1%2013: £1,490m
Asia-Pacific
Close
Volume
2013: 197bn
197bn
+0.1%2013: 197bn
Revenue at CC1
2013: £4,203m
£4,253m
+1.2%2013: £4,203m
Adjusted profit from operations2
2013: £1,693m
£1,548m
-8.6%2013: £1,693m
Adjusted profit from operations2 at CC1
2013: £1,693m
£1,713m
+1.2%2013: £1,693m
Share of Group revenue
27%
Asia-Pacific
Volume
2013: 197bn
197bn
+0.1%2013: 197bn
Revenue at CC1
2013: £4,203m
£4,253m
+1.2%2013: £4,203m
Adjusted profit from operations2
2013: £1,693m
£1,548m
-8.6%2013: £1,693m
Adjusted profit from operations2 at CC1
2013: £1,693m
£1,713m
+1.2%2013: £1,693m
Share of Group revenue
22%
Americas
Volume
2013: 134bn
131bn
-2.3%2013: 134bn
Revenue at CC1
2013: £3,317m
£3,506m
+5.7%2013: £3,317m
Adjusted profit from operations2
2013: £1,364m
£1,286m
-5.7%2013: £1,364m
Adjusted profit from operations2 at CC1
2013: £1,364m
£1,475m
+8.1% 2013: £1,364m
Share of Group revenue
23%
Western Europe
Volume
2013: 119bn
112bn
-5.9%2013: 119bn
Revenue at CC1
2013: £3,635m
£3,546m
-2.4%2013: £3,635m
Adjusted profit from operations2
2013: £1,273m
£1,189m
-6.6%2013: £1,273m
Adjusted profit from operations2 at CC1
2013: £1,273m
£1,262m
-0.9%2013: £1,273m
Share of Group revenue
28%
Eastern Europe, Middle East & Africa
Volume
2013: 226bn
227bn
+0.3% 2013: 226bn
Revenue at CC1
2013: £4,105m
£4,377m
+6.6% 2013: £4,105m
Adjusted profit from operations2
2013: £1,490m
£1,380m
-7.4%2013: £1,490m
Adjusted profit from operations2 at CC1
2013: £1,490m
£1,625m
+9.1%2013: £1,490m
Group share of key subsidiary markets*
+10bpts
Definition: This is our retail market share in the Group’s key markets, which cover around 80% of the volumes of subsidiaries.
Target: To continue to grow market share.
*Share figures are rebased annually to reflect market and segment changes.
Global Drive Brands' (GDBs) cigarette volume
278bn(+5.8%)
Definition: GDB volume is calculated as the total volumes of the five GDBs sold by our subsidiaries.
Target: To increase our GDBs' share faster than the rest of our portfolio.
Net turnover at constant rates of exchange
£15,682m(+2.8%)
Definition: Gross turnover net of duty, excise and other taxes.
Target: To grow NTO by 2–5% per year.
Adjusted diluted earnings per share at current rates
-3.9%
Definition: This is our adjusted diluted earnings per share (EPS) – the detail of the calculation and adjustments are explained in Note 7 in the Financial Statements of the Annual Report 2014.
Target: To grow adjusted diluted EPS at the rate of high single figures per annum, on average, over the medium to long term.
Total shareholder return (TSR) (compound annual growth rate)
11.4%
Definition: Total shareholder return (TSR) is measured according to the return index calculated by Datastream, on the basis of all companies’ dividends being reinvested in their shares. The return is the percentage increase in each company’s index over a three-year period.
Objective: The Group is focused on increasing shareholder value, which is measured using TSR compared to a fast-moving consumer goods (FMCG) peer group. The FMCG comparator group is reviewed annually to ensure it remains both relevant and representative.
Adjusted profit from operations at constant exchange rates
£6,075m (+4.4%)
Definition: This is the adjusted profit from operations of the Group’s subsidiaries – profit from operations at constant rates adjusted for the items shown as memorandum information on the Group Income Statement.
Target: The Group’s medium- to long-term target is to grow adjusted profit from operations on average by 5–7% per year.
Cash generated from operations at current rates
£2,660m
Definition: Cash generated from operations is defined as the free cash flow excluding restructuring costs and dividends and other appropriations from associates, per the alternative cash flow on page 42 of the Annual Report 2014.
Target: A specific target is set each year for the cash flow from operations.
Operating margin
38.7% (+54bpts)
Definition: This is the percentage of adjusted profit from operations divided by revenue.
Objective: To increase operating margin by 50–100 basis points per annum.
Free cash flow as a percentage of adjusted earnings
(excl. non-tobacco litigation) 76%
(excl. non-tobacco litigation) 76%
Definition: This measures our free cash flow per share as a ratio of the adjusted diluted earnings per share.
Target: To convert around 80% of our adjusted earnings per share to free cash flow.
Free cash flow as a percentage of adjusted earnings
64%
Objective: To convert around 80% of our adjusted earnings per share to free cash flow.
Employee engagement index
72%
Definition: Results from our biennial ‘Your Voice’ employee opinion survey, last carried out in 2014, enable us to calculate our employee engagement index – a measure that reflects employee satisfaction, advocacy and pride in the organisation.
Objective: To achieve a more positive score than the norm for 30-plus FMCG companies in our comparator benchmark group (the norm was 69% in 2014).
Carbon dioxide equivalent (CO2e)
(tonnes CO2e per million cigarettes equivalent produced) 0.83
(tonnes CO2e per million cigarettes equivalent produced) 0.83
45% lower than 2000 baseline
Definition: We track Group CO2e in tonnes per million cigarettes equivalent produced.
Target: To reduce Group CO2e by 50% by 2030 from our 2000 baseline of 1.52 and by 80% by 2050.
Group energy use
(gigajoules per million cigarettes equivalent produced) 10.26
(gigajoules per million cigarettes equivalent produced) 10.26
13% lower than 2007 baseline
Definition: We track Group energy use in gigajoules per million cigarettes equivalent produced.
Target: To reduce energy use to 9.82 by 2017, 17% lower than our 2007 baseline.
Water use
(cubic metres per million cigarettes equivalent produced) 3.69
(cubic metres per million cigarettes equivalent produced) 3.69
24% lower than 2007 baseline
Definition: We track Group water use in cubic metres per million cigarettes equivalent produced.
Objective: To reduce water use to 3.6 by 2017, 26% lower than our 2007 baseline.
Recycling (percentage of waste recycled)
92.6%
Definition: We track the total percentage of Group waste re-used or recycled against total waste generated.
Objective: To recycle more than 85% of waste generated in each year.
1 Constant currency (CC) provides the information based on a re-translation, at prior year exchange rates, of the current year information.
2 Adjusted profit from operations is derived after excluding the adjusting items from the profit from operations. These items include restructuring and integration cost, amortisation and impairment of trademarks and similar intangibles, a gain on deemed partial disposal of a trademark and a payment and release of provision relating to non-tobaco litigation (see page 44 of the Annual Report 2014).